Data
Power BI or Data Studio: which should you use?
By Felix Grant5 min read
Use Looker Studio if most of your data already lives in Google's tools, such as GA4, Google Ads, Search Console, Sheets and BigQuery, and you want free dashboards you can share like a Google Doc. Use Power BI if you run on Microsoft 365 and Excel and need to join finance, CRM and sales data into one model with proper measures, and you can pay £10.80 per user per month for everyone who views it. Google renamed Looker Studio back to Data Studio in April 2026. The product is the same, and we use the older name here because it is still what most people search for.
Compare
The short comparison
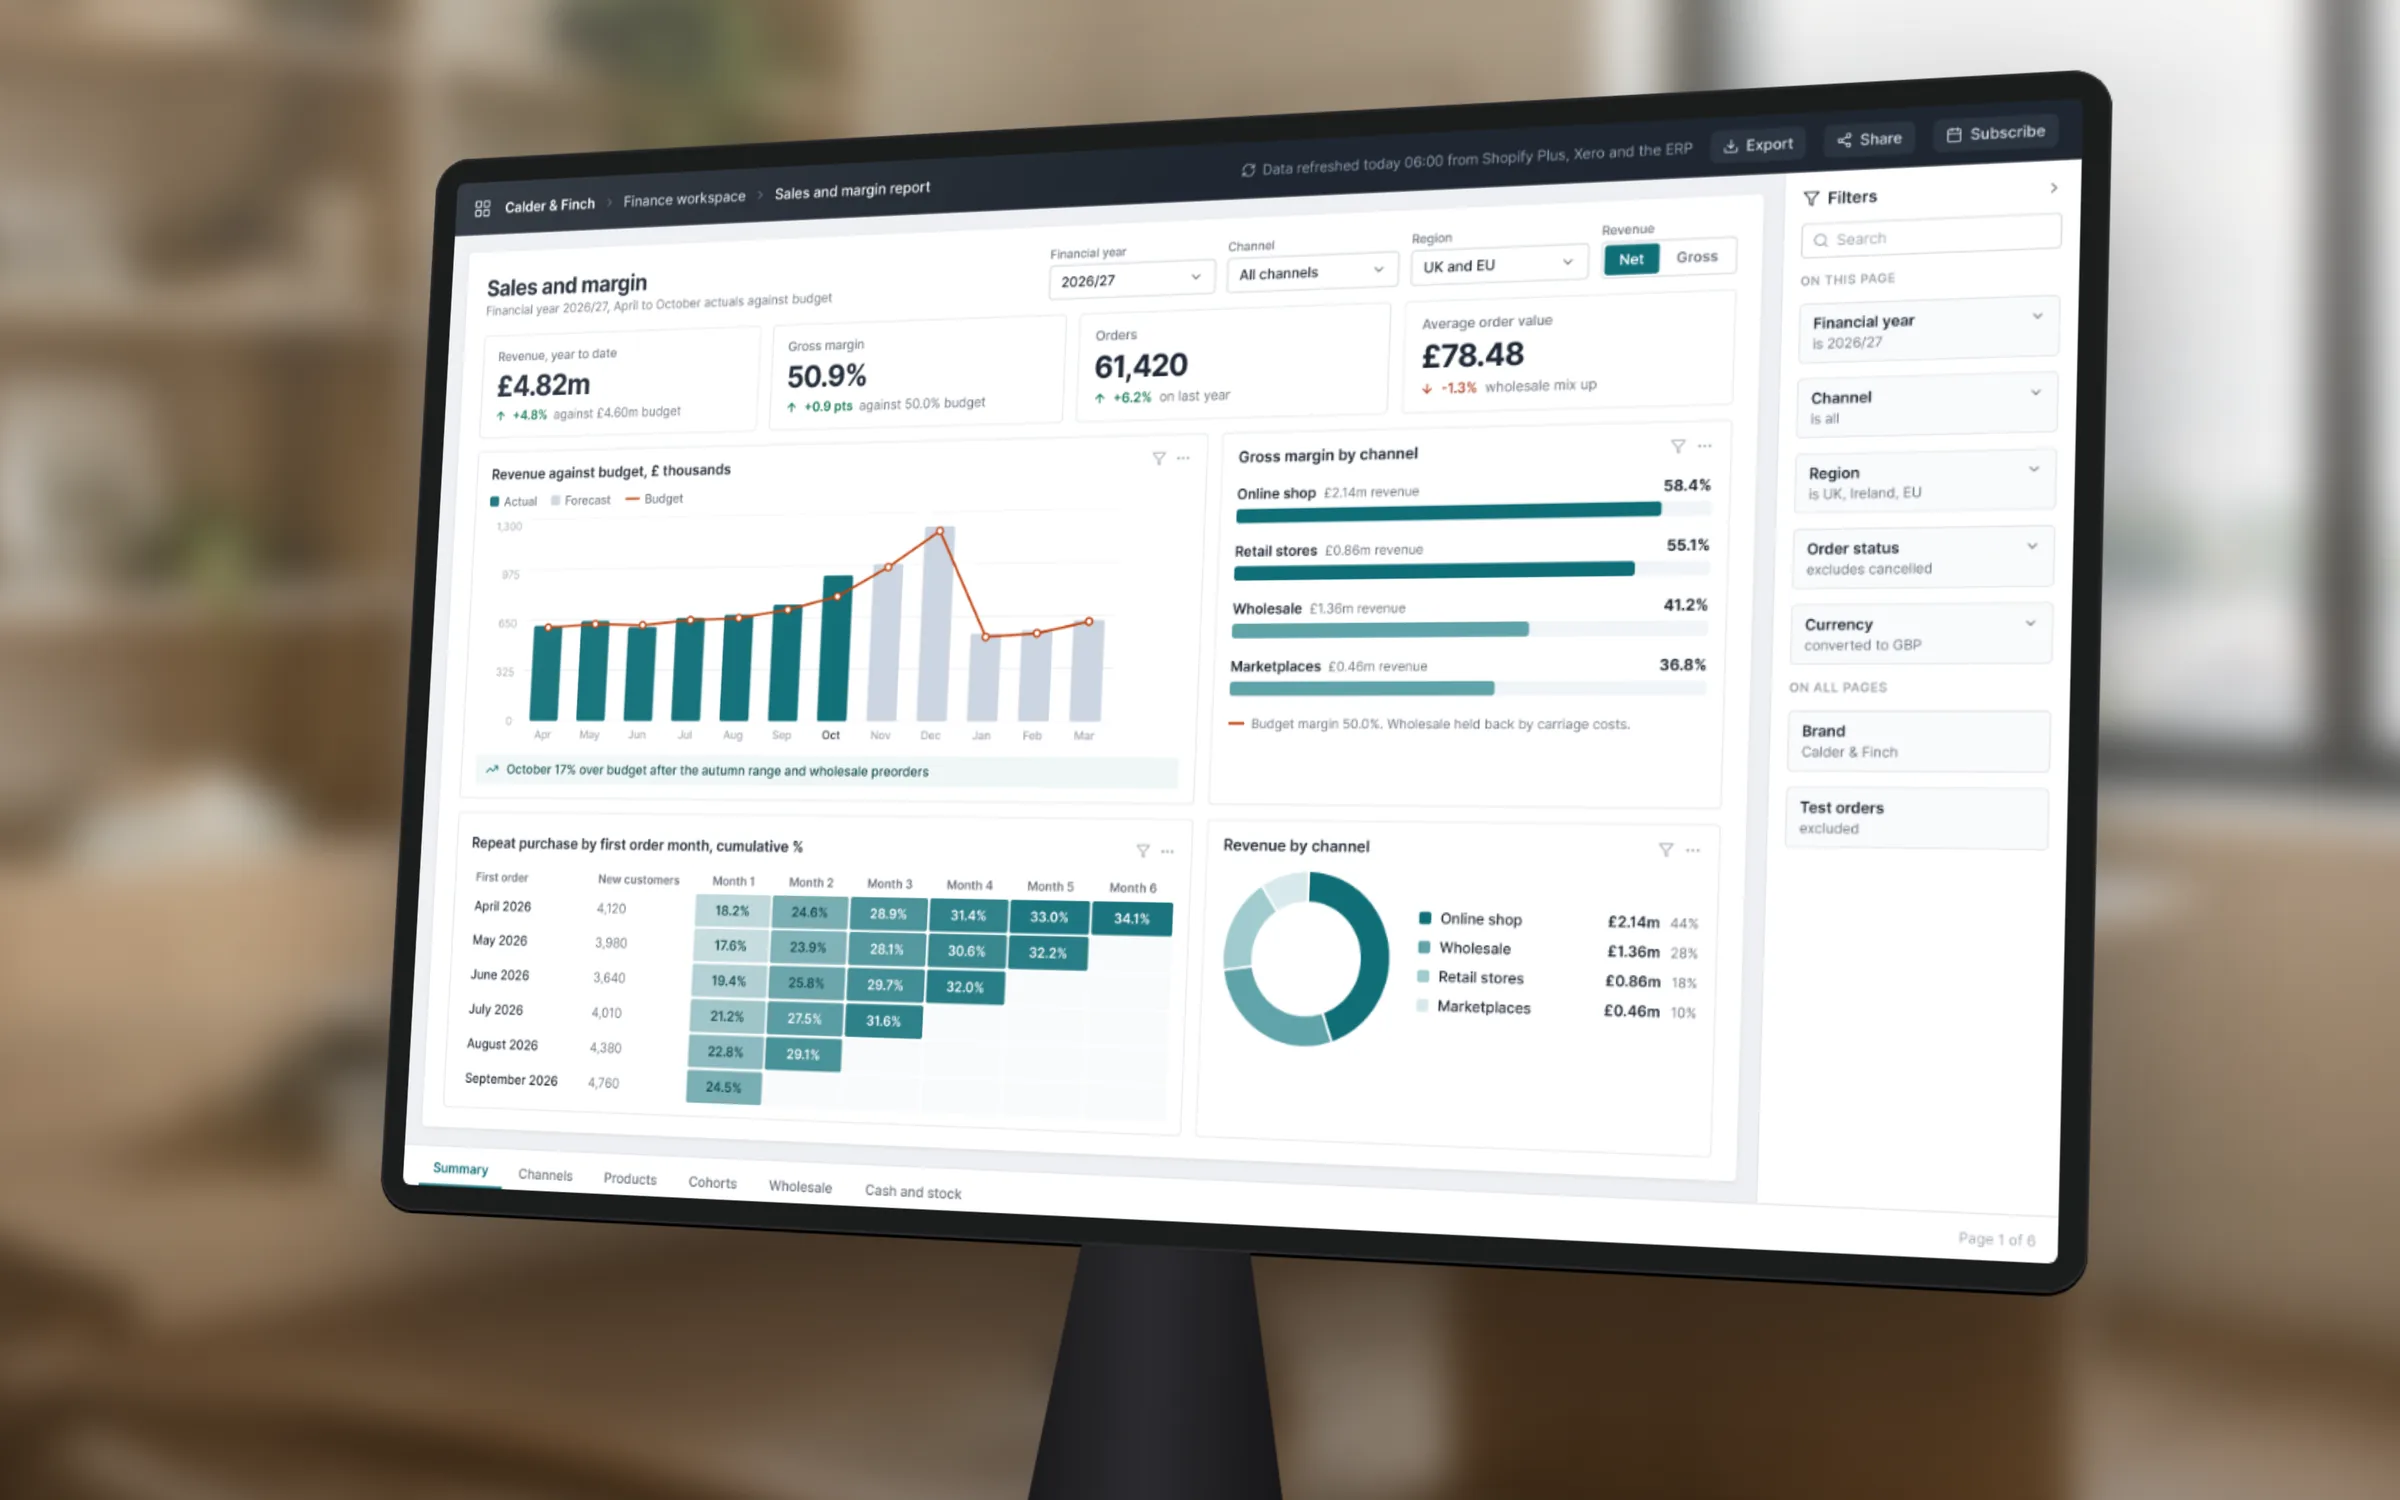
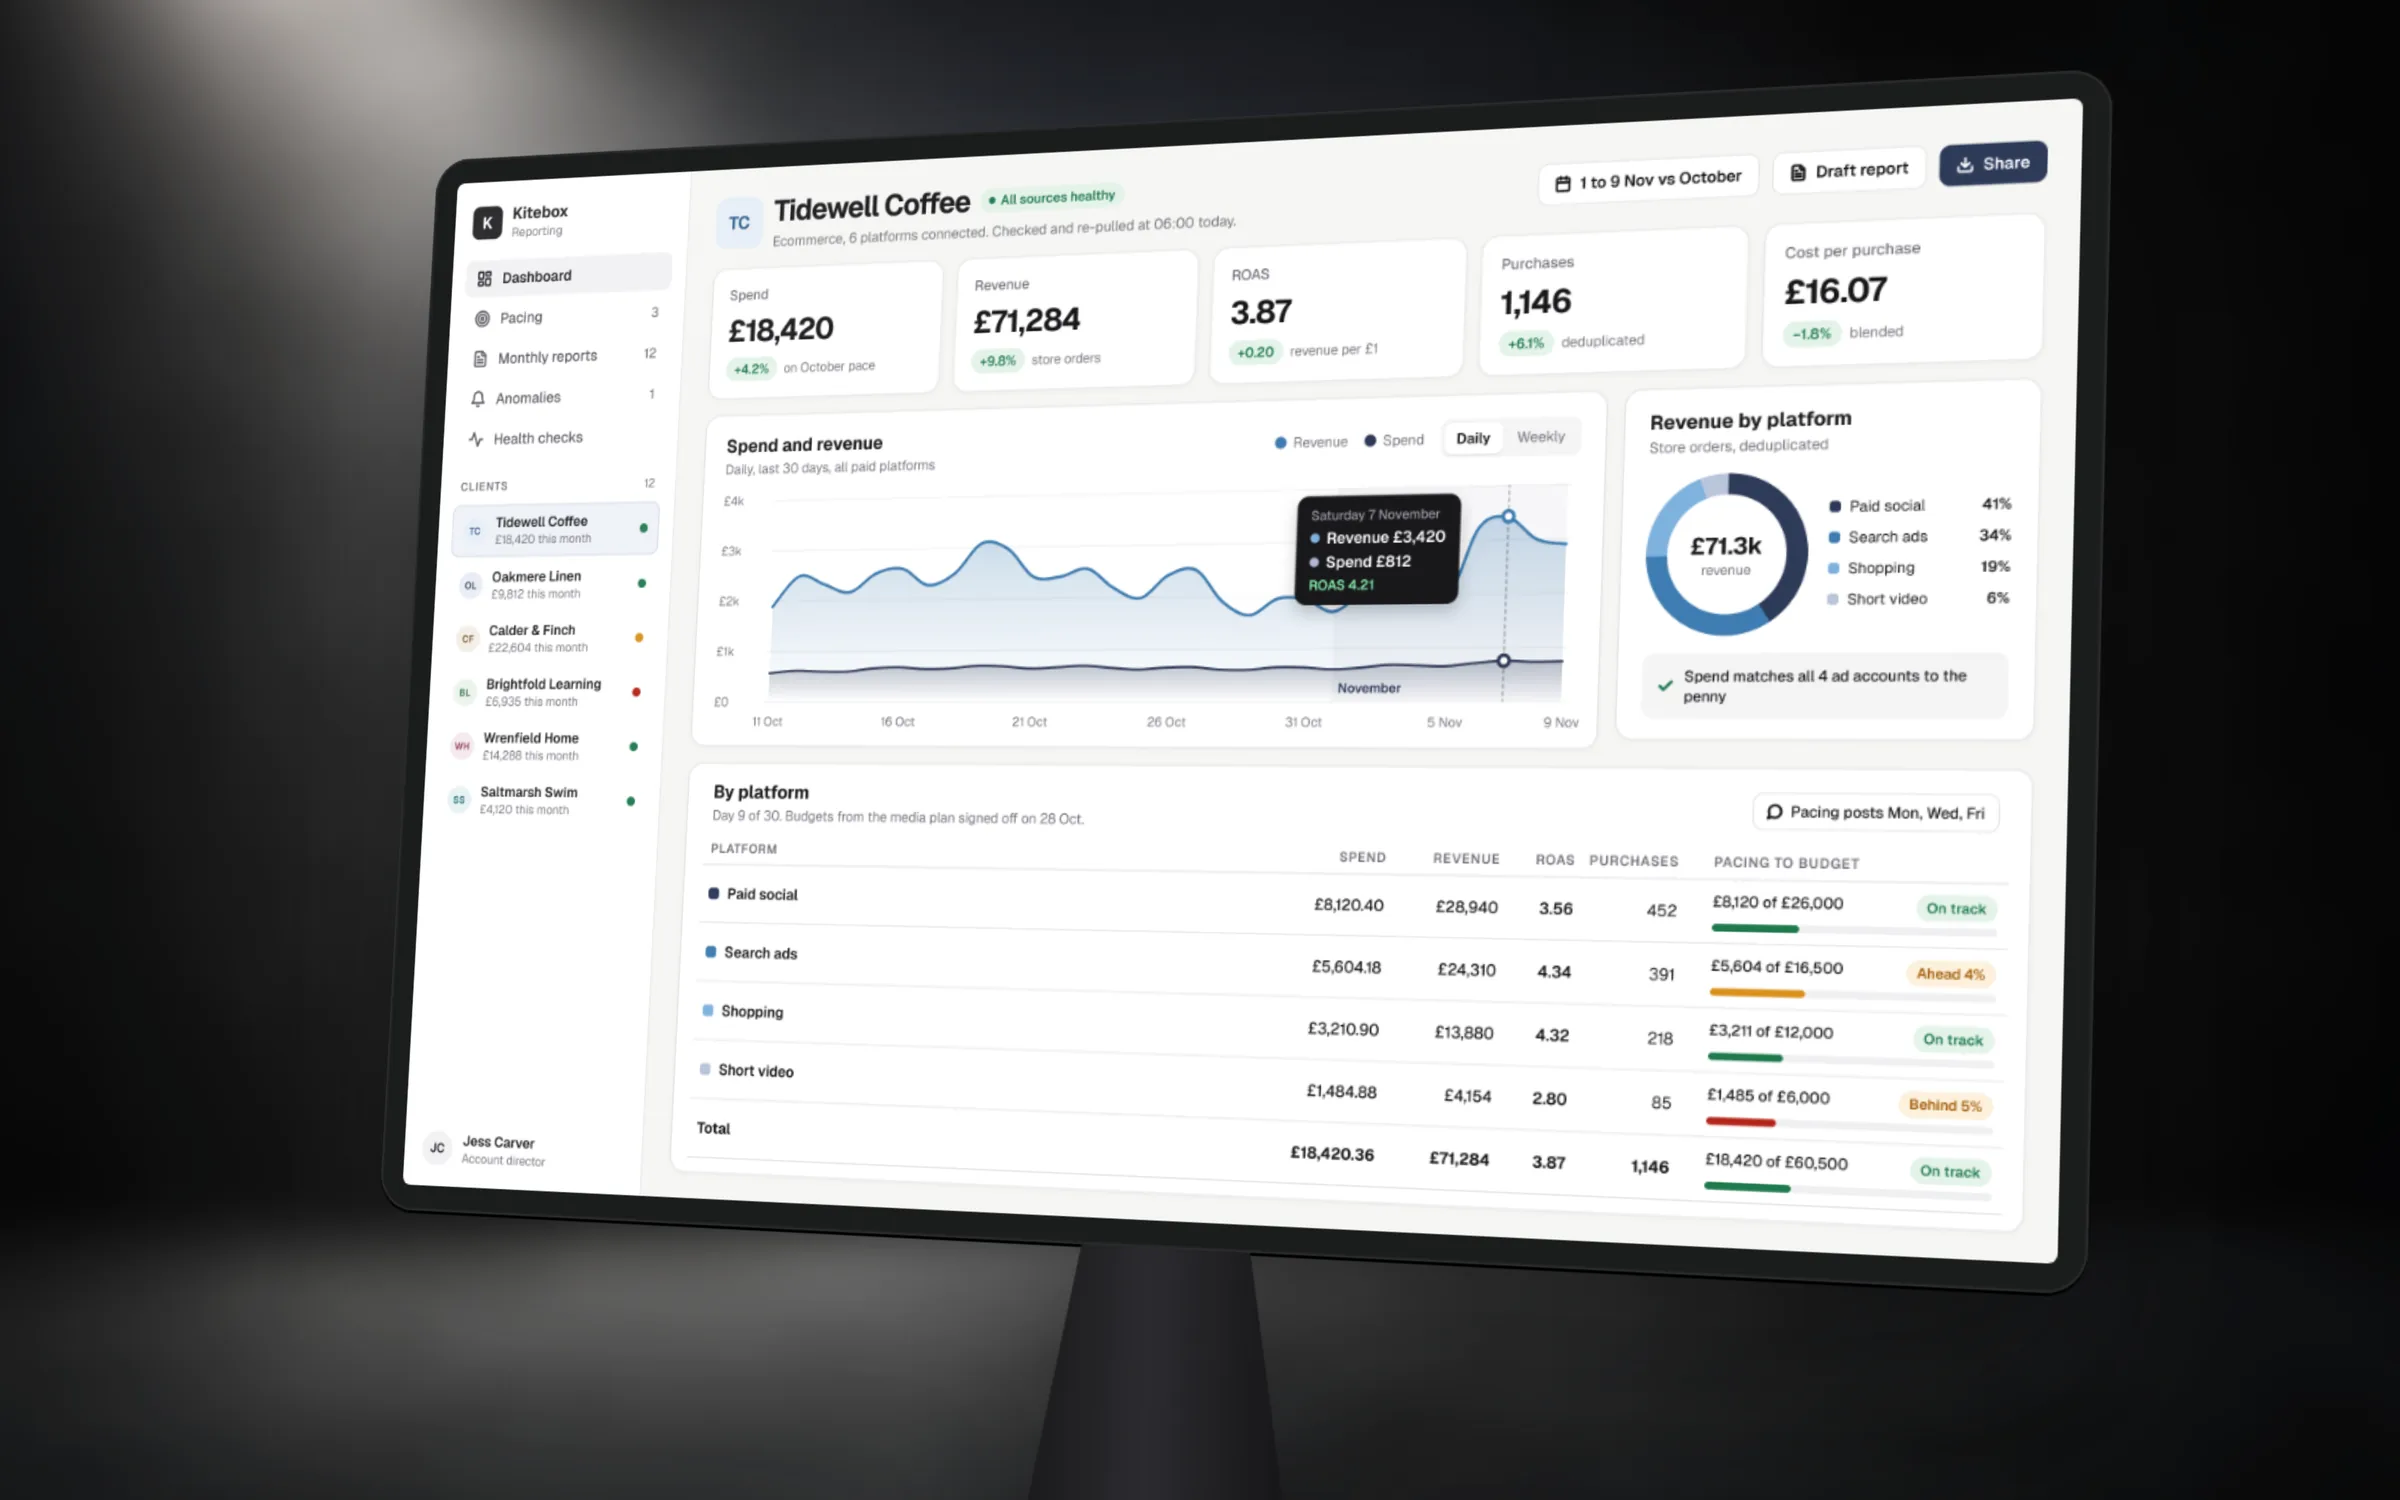
Looker Studio is a reporting layer. It connects to a source, lets you build charts and filters on top, and shares the result with a link. It is quick to start, free for most uses and at its best when the data is already clean and already in Google's ecosystem.
Power BI is a modelling tool with dashboards on top. You load several sources, define how they relate, write measures once and reuse them across every report. It takes longer to set up and costs money per viewer, but it handles messy, multi-source business data far better.
So the real question is not which has nicer charts. It is whether your problem is showing data that already agrees with itself, or making several systems agree in the first place. The first is a Looker Studio job. The second usually needs Power BI, or BigQuery underneath whichever tool you choose.
Pricing
What each actually costs
Looker Studio's standard version is free. Google also sells a Pro tier, bought through Google Cloud or the Workspace admin console, which adds team workspaces, organisation-level ownership of reports and support. Pro is licensed per user per month, so check the current pricing page before you budget. The hidden cost is connectors: Google's own sources are free, but connecting Meta Ads, LinkedIn, Xero or most CRMs usually means a third-party connector with its own monthly fee, often priced per source or per account.
Power BI has a free tier, but on Microsoft's UK pricing page a free account cannot publish or share reports. Sharing needs Power BI Pro at £10.80 per user per month, or Premium Per User at £18.50, both excluding VAT and paid yearly. In practice, everyone who creates or views shared content needs a licence. Licence-free viewing only arrives with large capacity purchases that cost far more than a small business needs.
Do the arithmetic for your team. Ten people viewing a Power BI dashboard on Pro is £108 a month, or £1,296 a year before VAT. If your company already pays for Microsoft 365 E5, Power BI Pro is included, which changes the sum entirely. Looker Studio for the same ten people may cost nothing, or a few hundred pounds a year in connectors.
Sources
Data sources and joining them
Looker Studio connects natively to GA4, Google Ads, Search Console, Sheets, BigQuery and a handful of databases. You can blend sources, but blending is limited and gets slow and fragile as reports grow. Calculated fields live inside each data source or report, so the same definition of revenue can end up written three slightly different ways.
Power BI pulls from Excel, SharePoint, SQL databases and hundreds of other connectors through Power Query, where you can clean and reshape data before it reaches a chart. Relationships between tables and measures written once in the model mean revenue is defined in one place, and every report uses that definition.
That difference matters most when Finance is in the room. If the board pack needs revenue net of VAT and refunds from your accounting system, matched against orders from Shopify and leads from the CRM, Power BI handles it more cleanly. If the question is how campaigns performed in GA4 and Google Ads last month, Looker Studio answers it faster and cheaper.
BigQuery
Where BigQuery fits
BigQuery is Google's data warehouse, and it often settles the argument. Both Looker Studio and Power BI can read from it, so you can do the heavy joining and cleaning in BigQuery and keep whichever reporting tool your team prefers.
It is worth adding when you need GA4 data without the limits of the standard interface, when you want to join several sources before reporting, or when dashboards have become slow. GA4's BigQuery export is free to set up, and standard properties can export up to 1 million events a day. BigQuery's free tier covers the first 10 GiB of storage and 1 TiB of queries each month. Beyond that, on-demand queries are charged per TiB processed, so a poorly written dashboard that rescans a large table on every view can quietly cost money.
For most small businesses, BigQuery is not the first step. It becomes the right step when the second or third dashboard needs the same joined data as the first.
Pick the tool your team will still open in a year.
Our choice
Who maintains it, and how we choose
Dashboards rot. A source changes a field name, a connector expires, a new product line appears and nobody updates the measure. Looker Studio is easier for a marketer to edit, but definitions scatter across reports. Power BI keeps definitions in one model, but someone needs to understand the model to change it safely. Before choosing, name the person who will fix it when a number looks wrong.
Our rule of thumb: Looker Studio for marketing reporting on Google data, maintained by the marketing team. Power BI for business reporting across finance, CRM and ecommerce, especially where the company already runs on Microsoft 365. BigQuery underneath either when volumes or joins demand it.
We build in all three, and on one agency reporting platform we matched net sales to an attribution tool within £1 for a fiscal month. If you are not sure which fits, a Discover workshop at £950 agrees the questions, sources and audiences and leaves you with a written dashboard plan.
Key takeaways
- Looker Studio for Google data, shared freely and maintained by marketers
- Power BI for joining finance, CRM and sales data in one model
- Power BI Pro is £10.80 per user per month before VAT, for every viewer
- Budget for third-party connectors if Looker Studio needs non-Google data
- Add BigQuery when joins, volume or GA4 limits start to hurt

Written by
Felix Grant
Founder of Kitebox, a business technology and AI consultancy that builds what it recommends. Based in Mallorca, working with UK businesses.
About Felix →