Services / Power BI consultant
A Power BI consultant for
dashboards your team trusts.
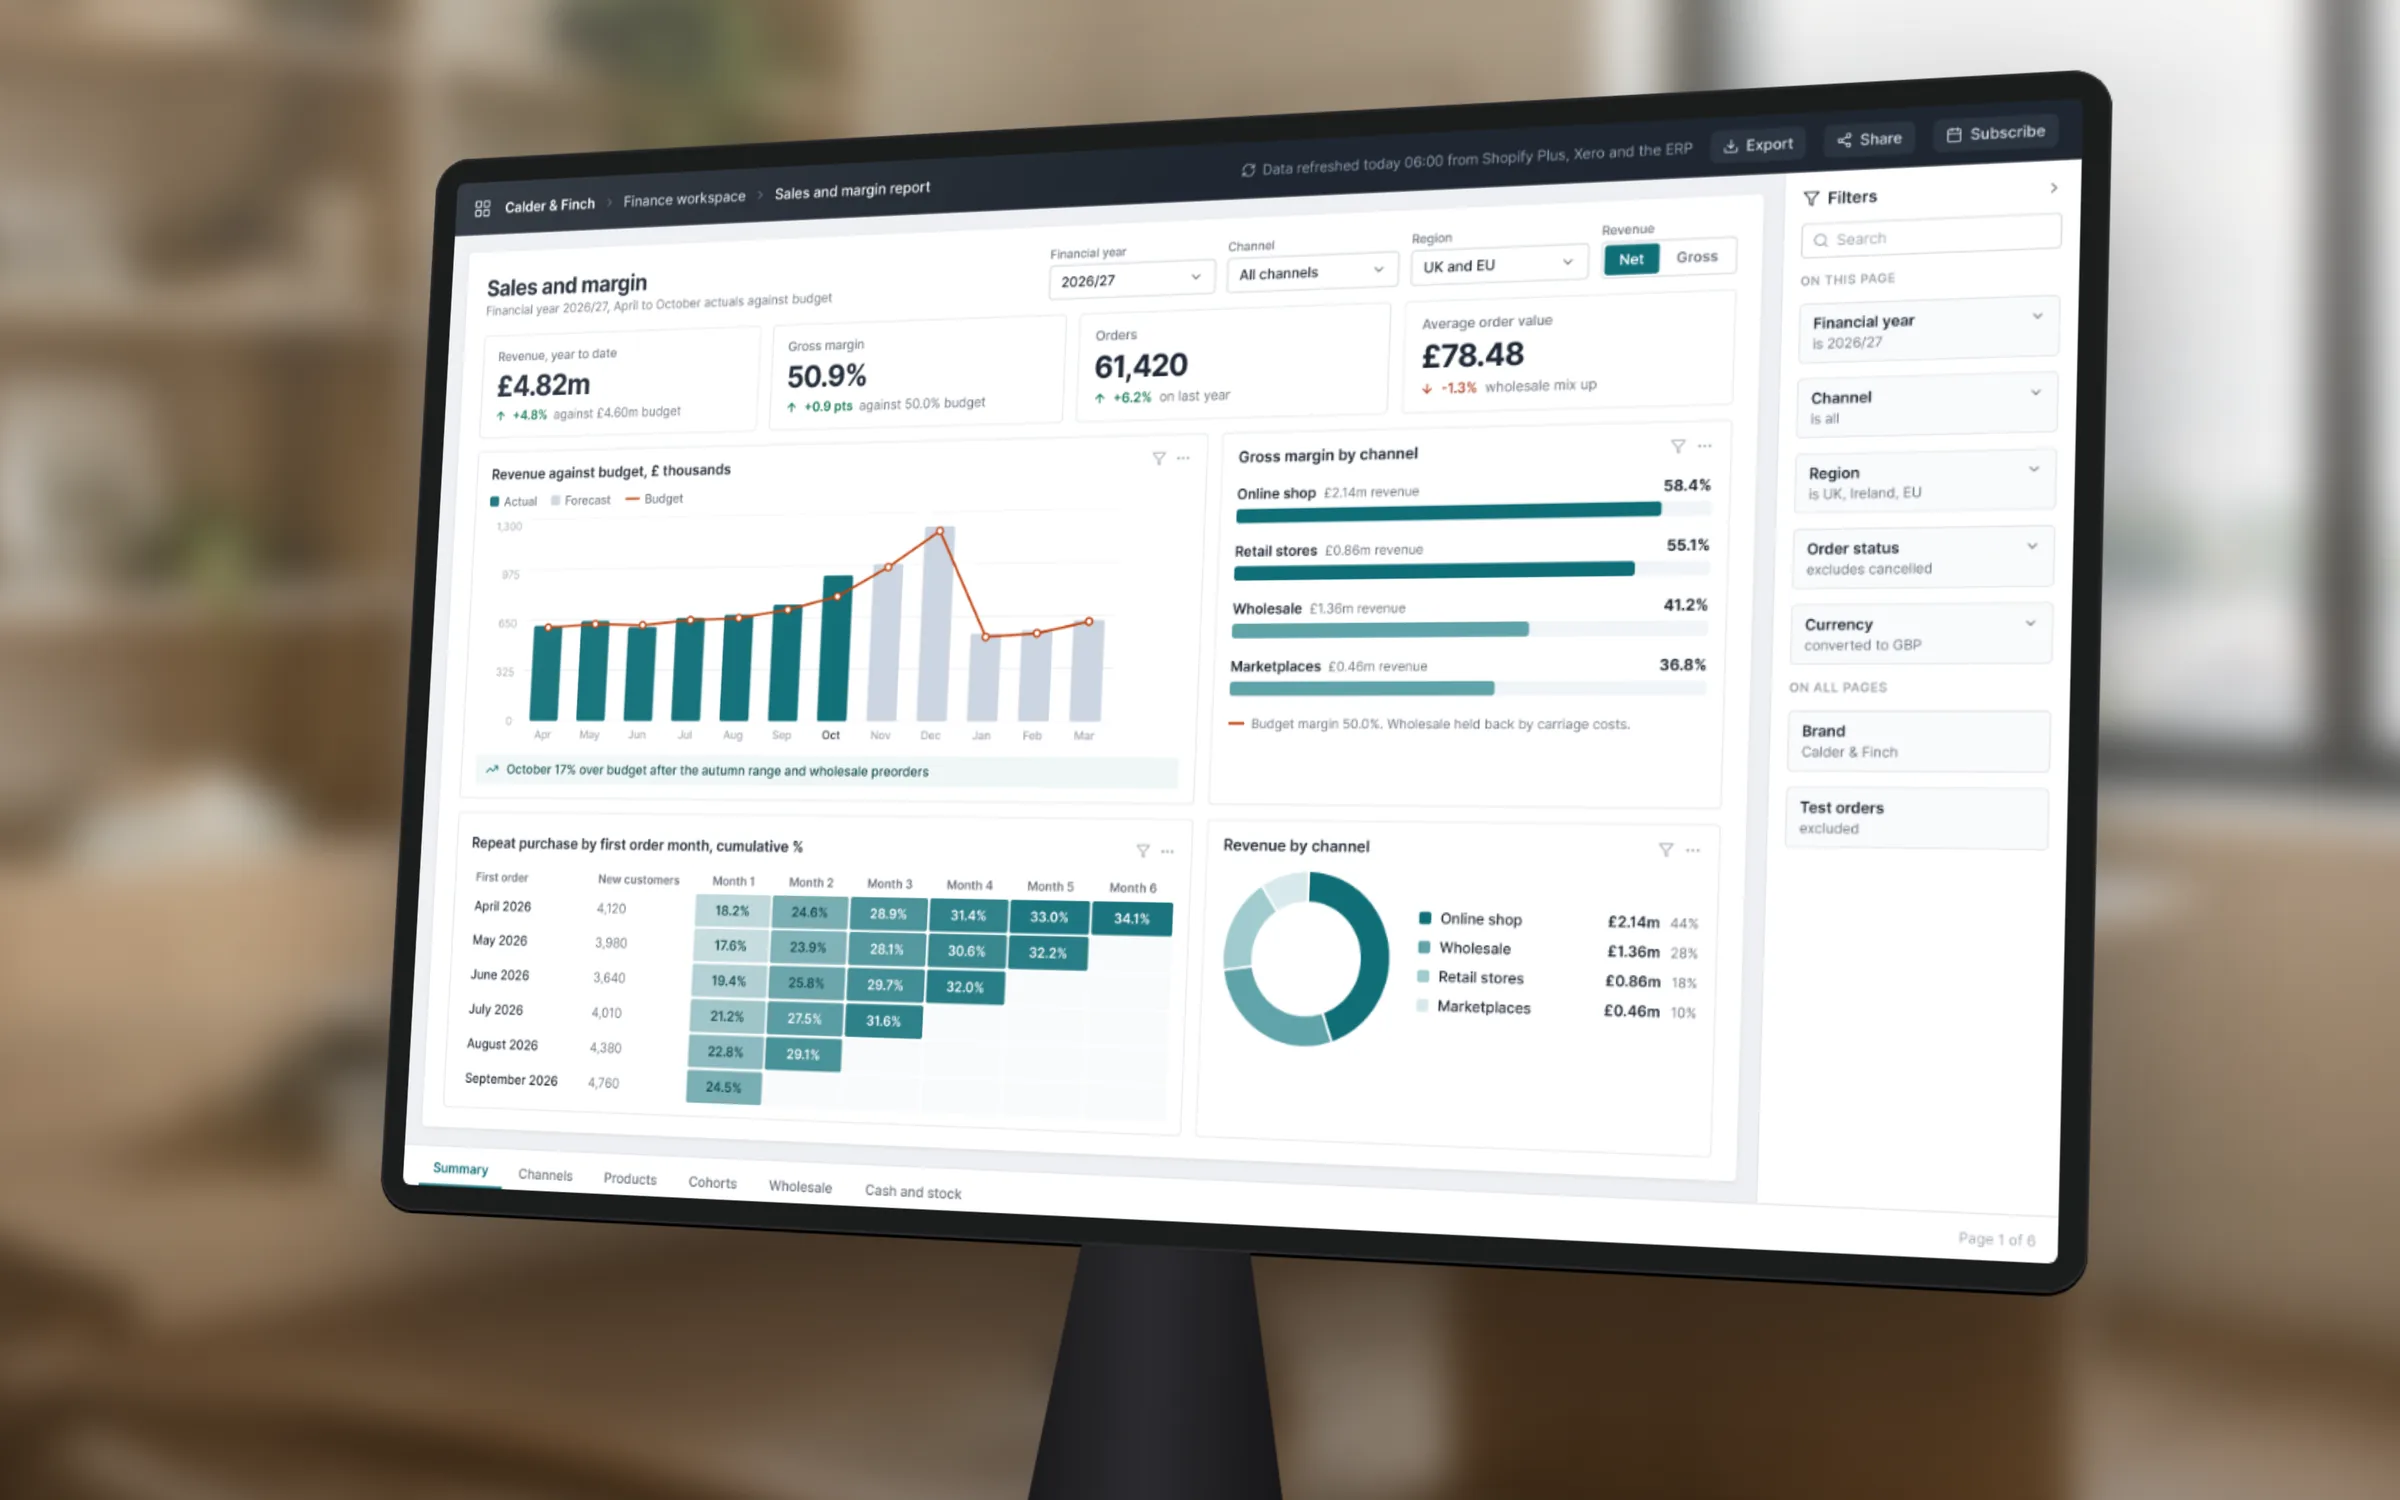
Power BI consulting for businesses whose reports are still built by hand. As your Power BI consultant we design the data model, connect your finance, CRM, ecommerce and ads data, and build dashboards your team trusts. If Looker Studio or BigQuery suits you better, we will say so and build that instead.
Builds from £2,500
Power BI, Data models, Looker Studio, BigQuery, Finance, Training
Sound familiar?
The report takes days,
and nobody trusts it.
Most businesses have plenty of data. What they lack is one model of it that everyone agrees on.
01
Reports built by hand.
Someone exports five spreadsheets every month and stitches them together.
02
Numbers that disagree.
Finance, sales and marketing each bring a different figure to the same meeting.
03
A file nobody owns.
The Power BI report was built by someone who has since left, and nobody dares touch the measures.
04
Licences, no adoption.
You pay for Power BI, and the team still asks for the spreadsheet.
What you get
Dashboards built on
a model that holds.
We start with the data model, because a dashboard is only as good as the numbers underneath it.
01 · Model
A proper data model.
Tables, relationships and measures designed around how your business reports, not around whatever the export looked like.
02 · Connect
Your data, connected.
Finance, CRM, ecommerce and ad platform data pulled in on a schedule, with checks that flag a broken source.
03 · Dashboards
Dashboards for each audience.
A board view, a sales view and a marketing view, each built around the questions those people ask every week.
04 · Reconcile
Numbers that reconcile.
Revenue checked against your accounts before anyone relies on it, with every gap explained.
05 · Options
Looker Studio and BigQuery.
If your data lives in Google's tools, we work as a Looker Studio consultant instead, often on BigQuery. We recommend whichever fits.
06 · Training
Training your team.
Hands-on sessions so your team can use, filter and extend the dashboards without calling us.
How it works
Model first,
then the visuals.
Nothing is presented as finished until the key figures have been checked against source.
6
Ad and analytics platforms joined in one reporting platform
01
Discover
We agree the questions the dashboards must answer, and list every data source behind them.
02
Model and connect
Data connected and modelled, with refreshes scheduled and a check on each source.
03
Build and reconcile
Dashboards built, and every key figure reconciled against your accounts or platforms.
04
Train and hand over
Your team trained, with documentation for every measure and source.
Case study
Data and reporting · Performance marketing agency
552
Six platforms, one set of numbers clients can trust
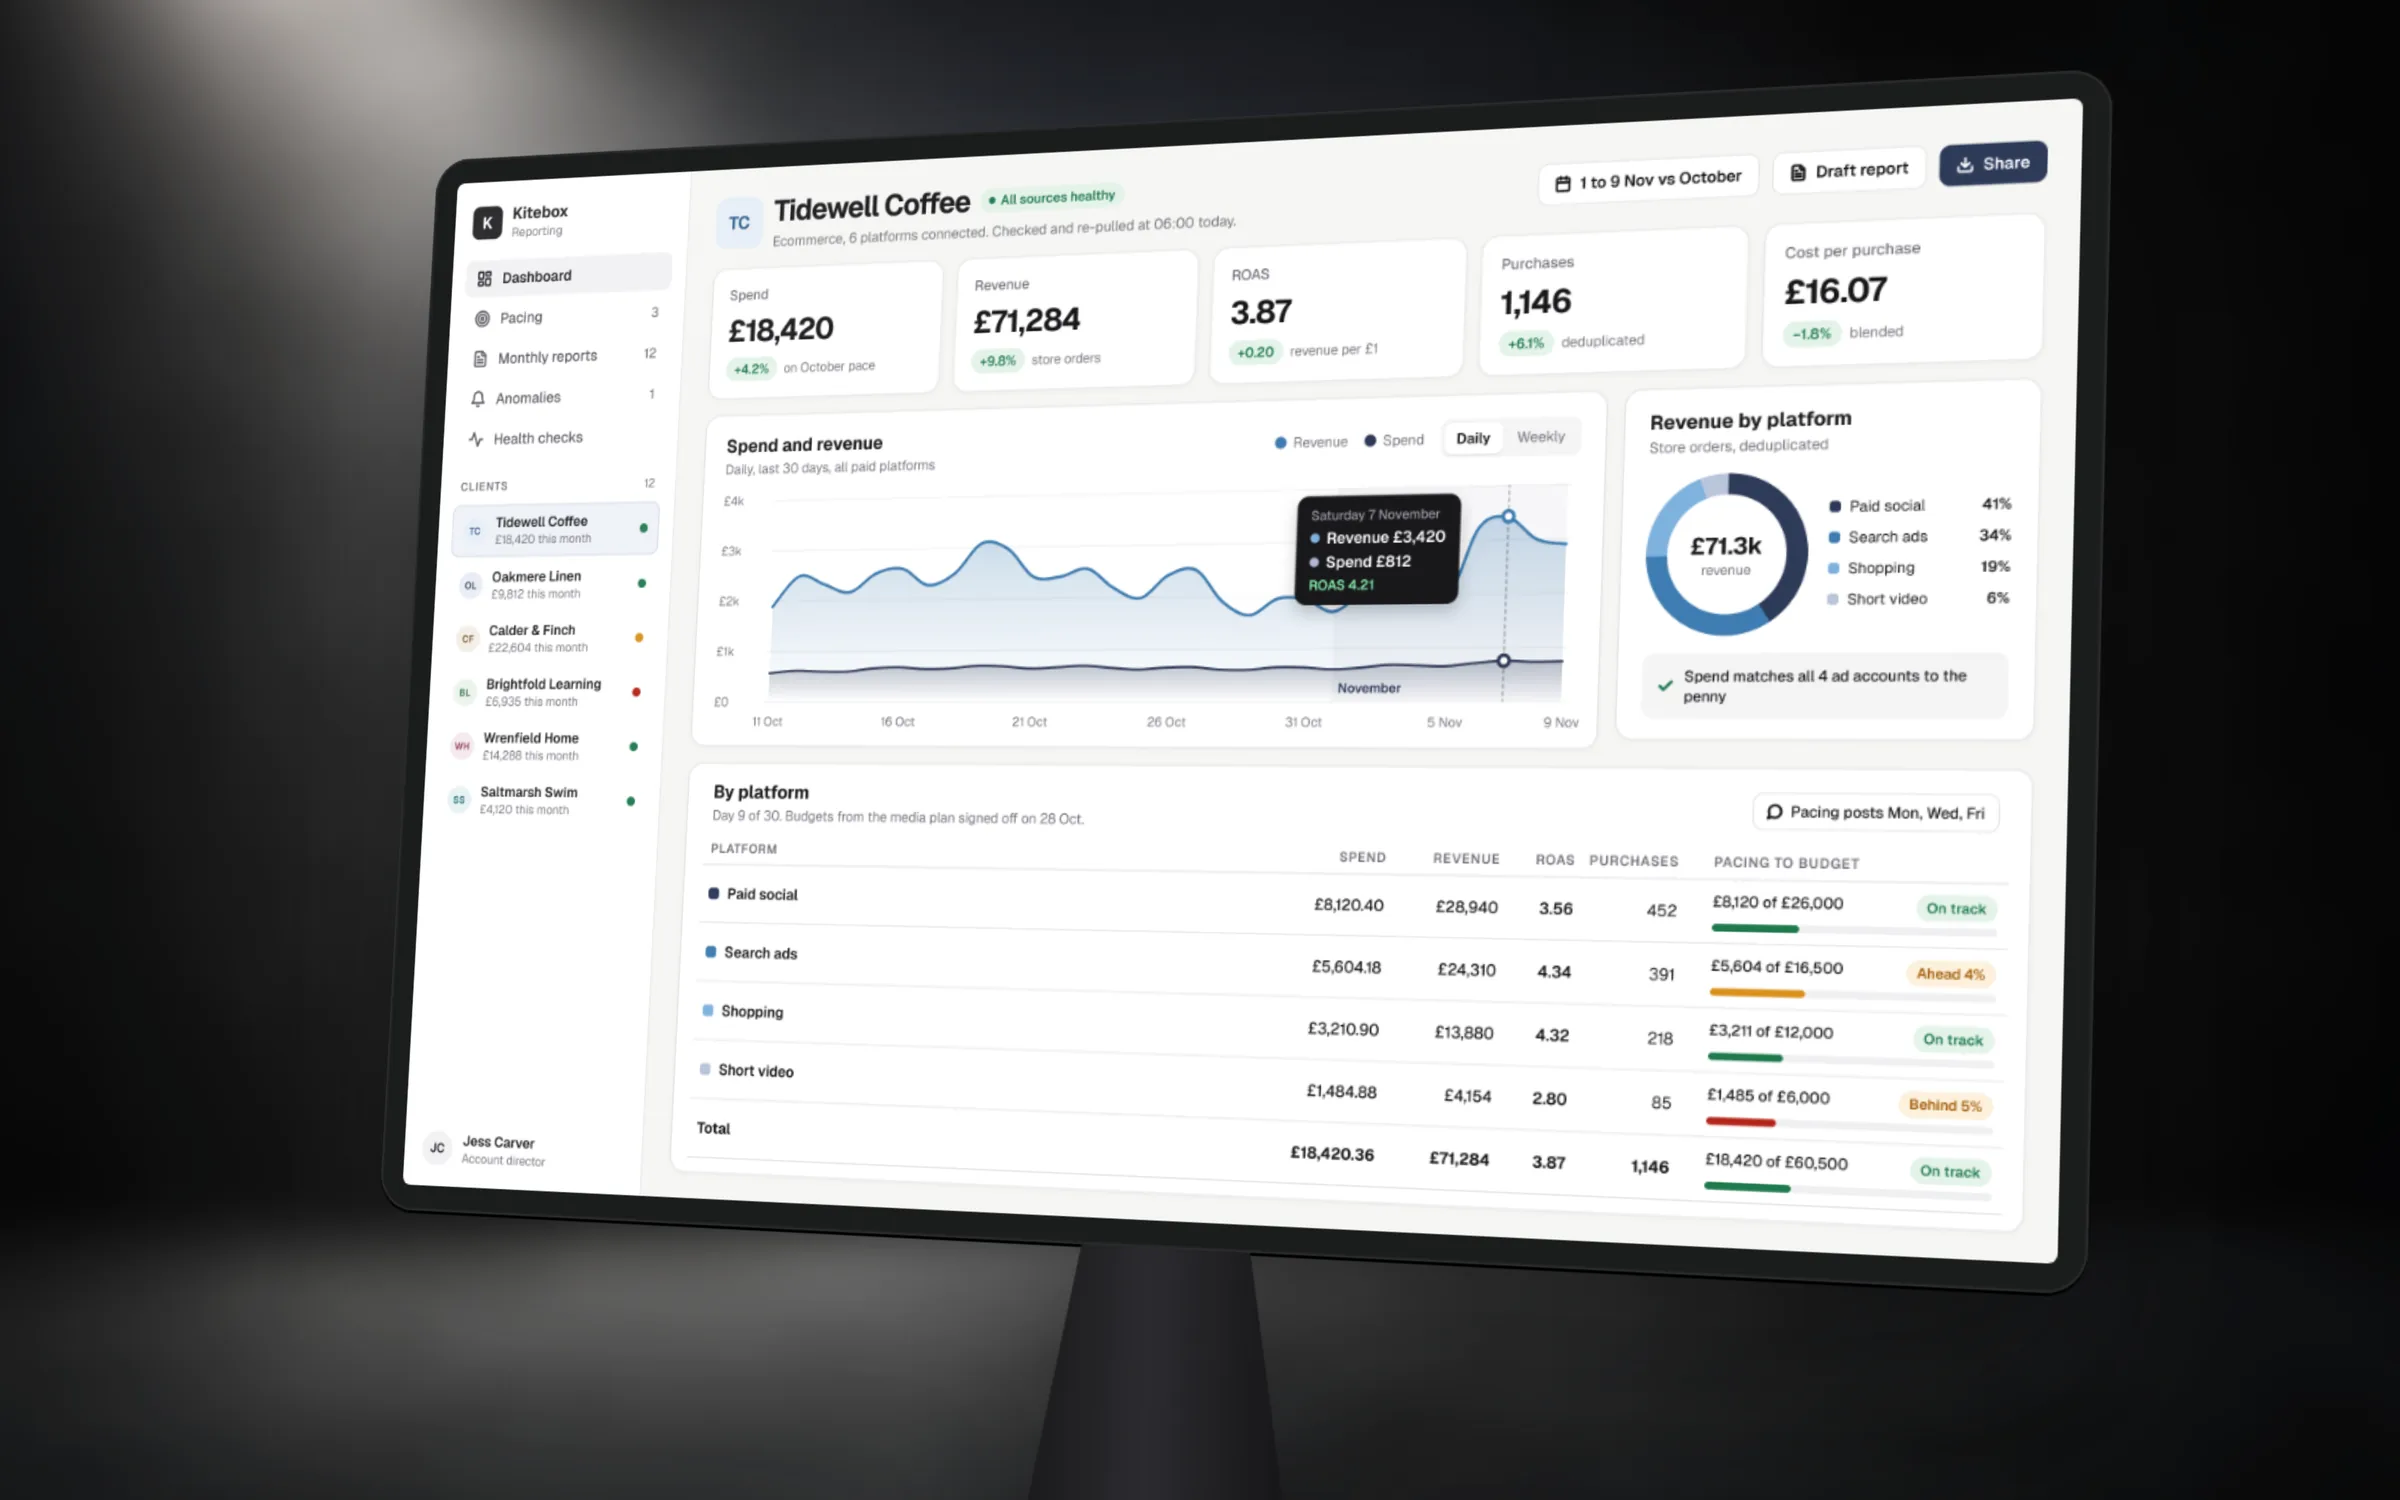
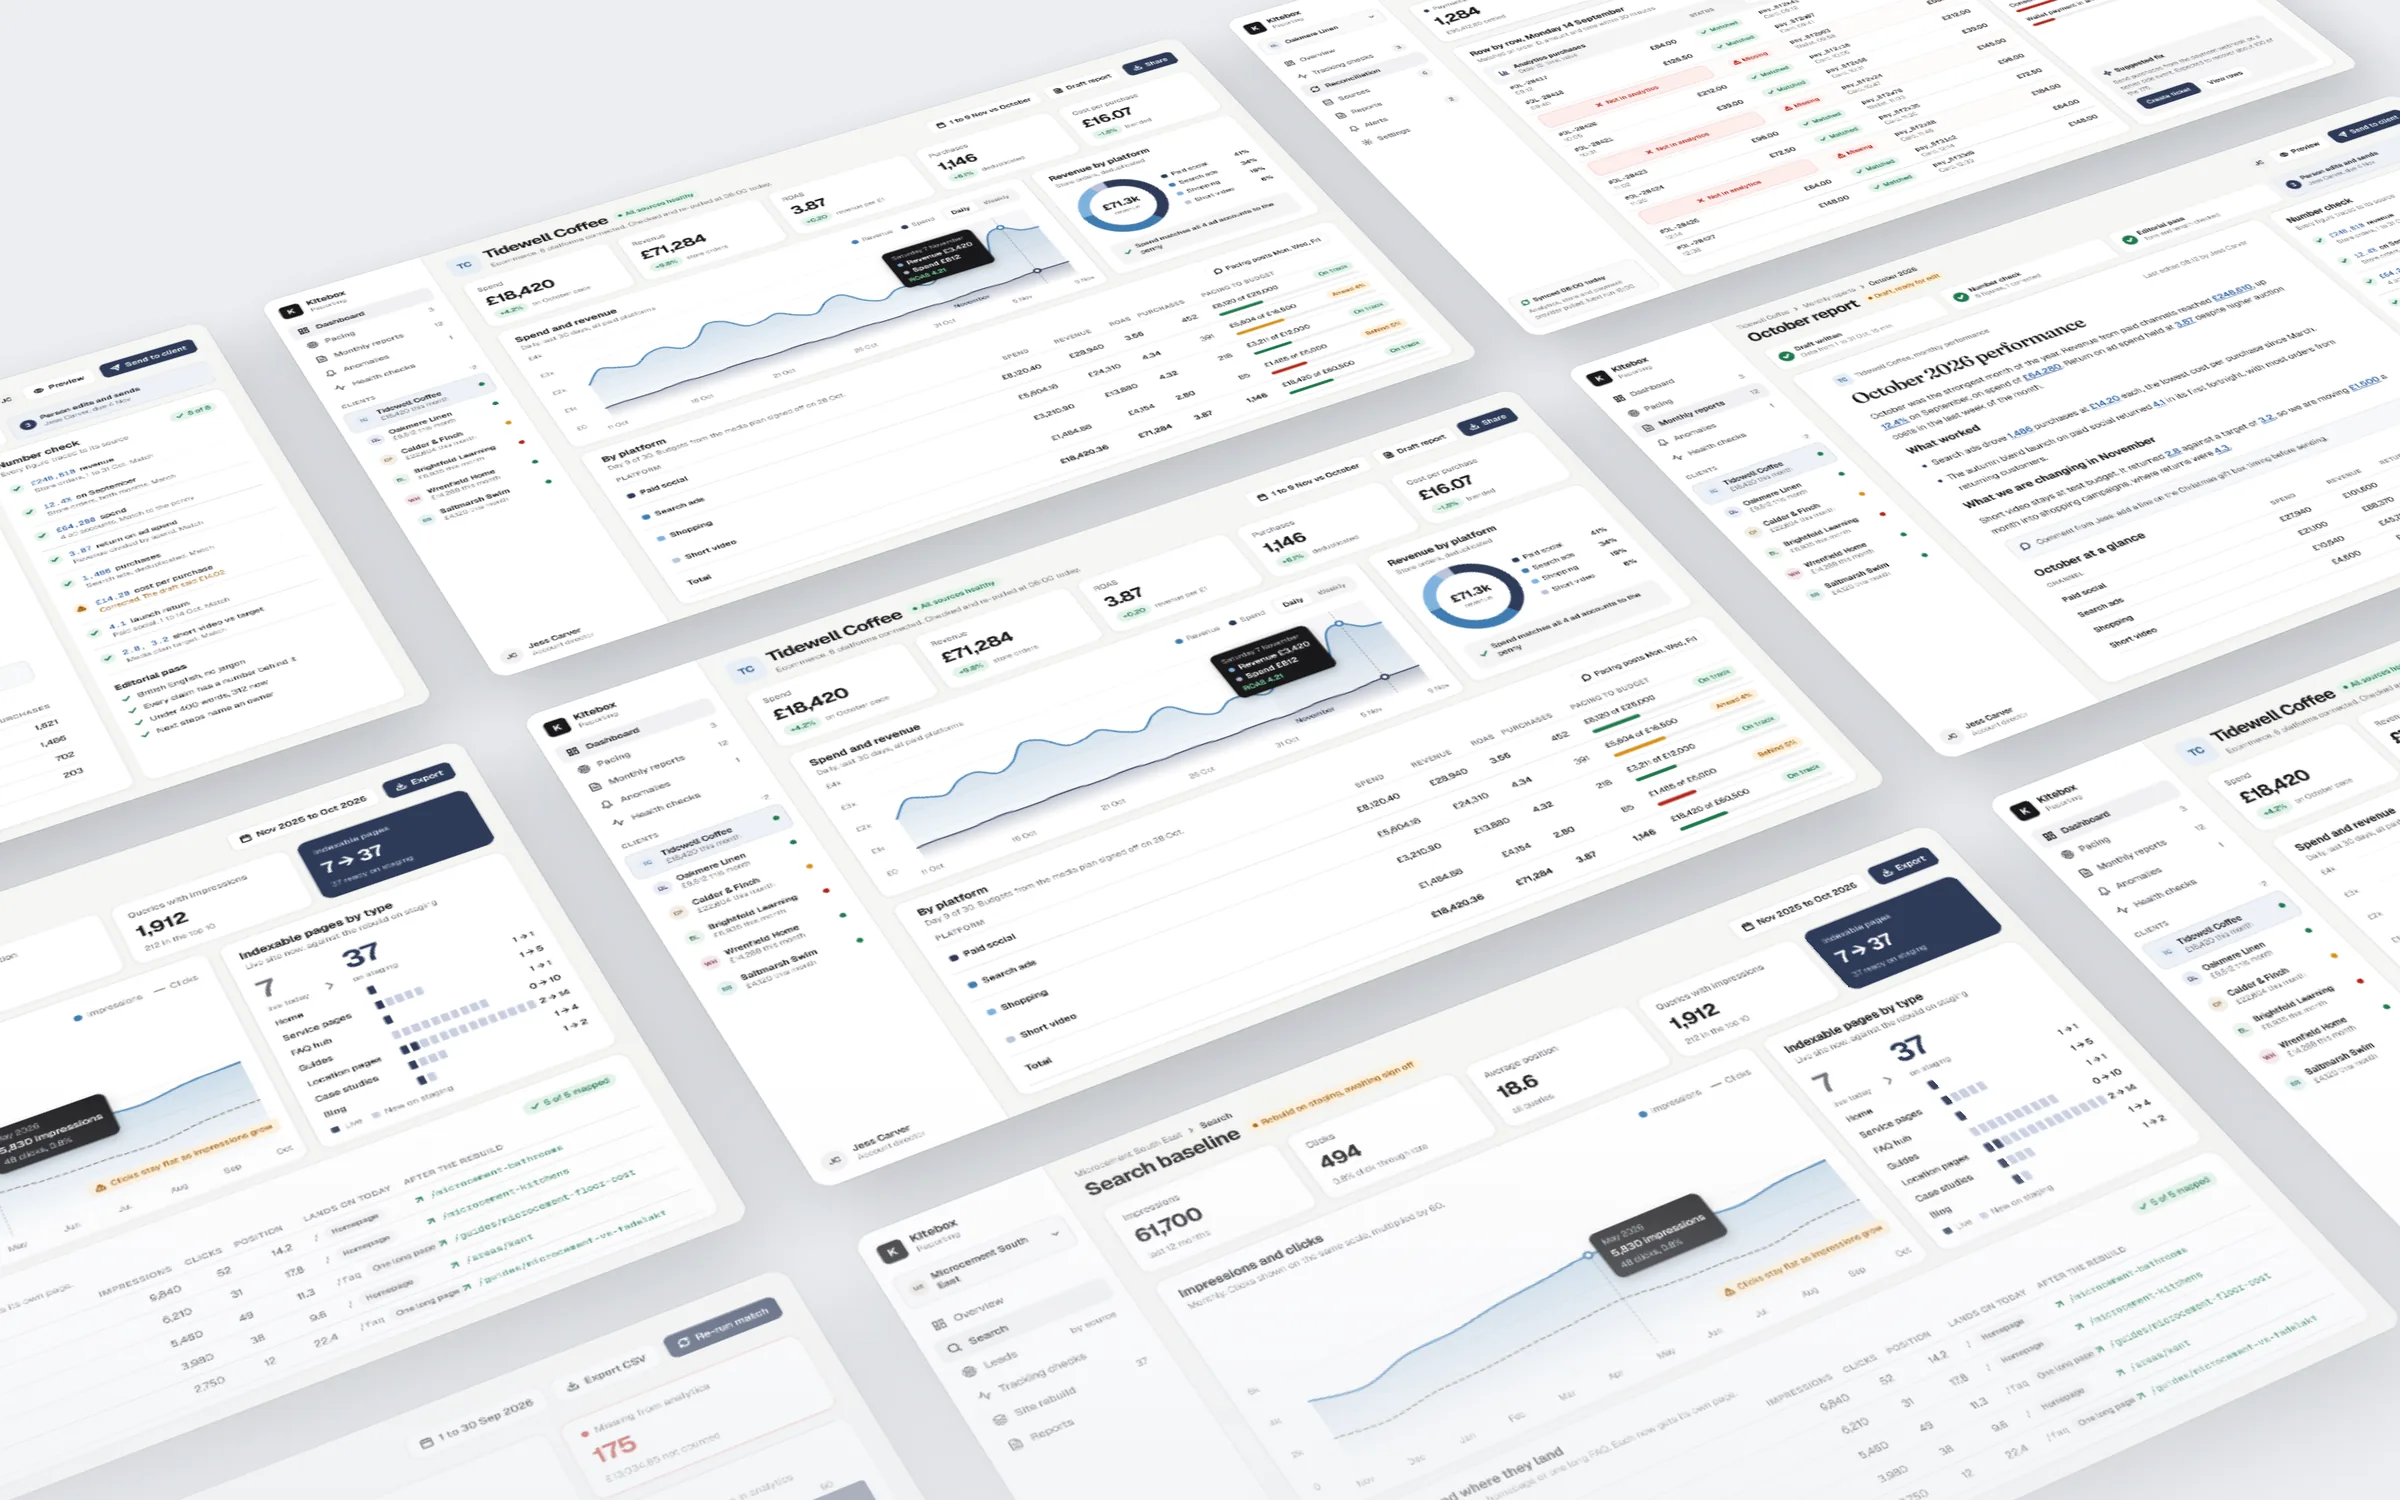
A London performance marketing agency rebuilt figures by hand from every ad and analytics platform. We built a reporting platform that pulls data daily from six core platforms, checks each source and adapts its dashboards to each brand.
- Data pulled daily from 6 core platforms
- Health checks that name the broken source
- Ad spend pacing matched live accounts to the penny on first run
- 552 uncounted purchases recovered for one client
- Net sales reconciled within £1 for a fiscal month
Client anonymised. Built at Kinsman & Co.
Read the case study →5.3%
Revenue with no source, down from 51.9%
£2
Gap to Finance on a reconciled fiscal month
15 min
To draft a monthly client report, per brand
Price
Start with
one dashboard.
Most clients start with the report that takes longest to build by hand, then add the next.
- Discover workshopAgree the questions, sources and audiences, and leave with a written dashboard plan.£950
- Data auditYour sources, existing reports and Power BI files reviewed, with a costed plan. Credited against a build.£1,950
- BuildData model, connections and dashboards built, reconciled and handed over with training.from £2,500
- PartnerMonitoring, fixes, new reports and training each month.from £1,500 a month
Questions
Questions about
Power BI.
Click a question to open it.
Yes. We build Power BI data models, measures and dashboards, publish them to your workspace and set up scheduled refreshes. We also build in Looker Studio and BigQuery when those suit you better.
If you run on Microsoft 365 and Excel, Power BI usually fits. If your marketing data already lives in GA4, Google Ads and BigQuery, Looker Studio can be simpler and cheaper. We recommend whichever your team will still use in a year.
Accounting systems such as Xero, CRMs such as HubSpot and Salesforce, Shopify and other ecommerce platforms, GA4 and the ad platforms. If a source has an export or an API, we can usually bring it in.
Yes. We review the model and measures, document what each one does, fix what is wrong and tell you honestly whether it is worth keeping or rebuilding.
Yes. Every build ends with hands-on training and written notes, so your team can use, filter and extend the dashboards themselves.
It depends mostly on how many sources need connecting and how clean they are. You get a written scope and timeline before we start, and the audit fee is credited against the build.
Other services
Dashboards, pipelines and forecasts you can trust.
GA4 audits and revenue that matches the bank.
Clean CRM data to report from.
Which numbers
do you argue about?
Tell us which report takes longest to build. We'll tell you what a dashboard for it would take, and what it would cost.